
They say an image is worth a thousand words, so there will be occasions when writing effective alt text for an image would require an unreasonably long description, particularly for images such as graphs, charts and infographics. In these cases, there are a few things that you can do.
1. Think about what information the image is trying to convey
You don’t have to describe every detail in an image, your alt text just needs to get across the information that a user who can see the image is expected to glean from it. Therefore you might be able to write a very succinct description of those key points, or if a visible caption or the surrounding text has already made the point adequately you might even be able to mark the image as decorative.
2. Can you use something different?
A well constructed table within your document (or an appendix) can often provide the same information as a chart or graph in a way that would be accessible.
3. Use the Complex Image Formula
This is a statement that you can use as alt text which explains that an image is too complex to describe with a short piece of text, and which invites students who require assistance to contact you.
It looks like this:
[image type] illustrating [data type] showing [reason for including image]. This is a complex image and may require specific support for visually impaired students – please contact your subject tutor with the subject line alt-text if required.
So for example:
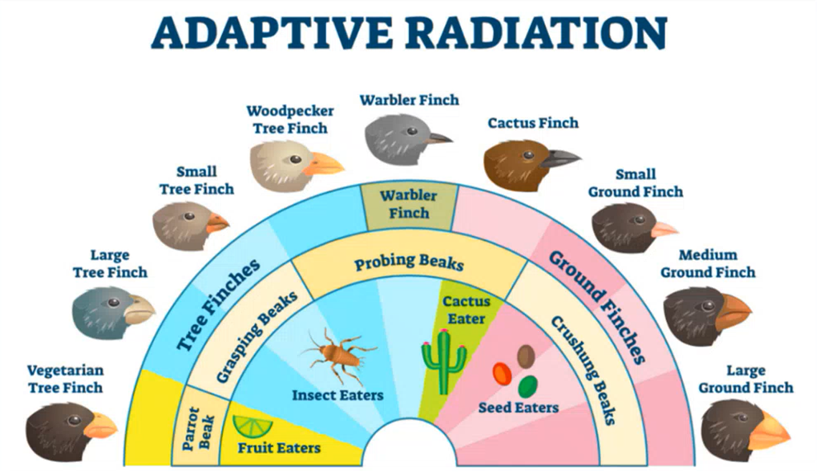
A half sunburst diagram illustrating the adaptive radiation of finches showing the variety of finches, their beaks and their diet. This is a complex image and may require specific support for visually impaired students – please contact your subject tutor with the subject line alt-text if required.