There is a useful feature in Brightspace that allows you to see a report of engagement across the content in your module.
This report can be seen per content item as well as per user.
This blog post will be looking at what the content report is capable of.
A link will be provided at the end to a full How-to-Guide showing the process.

Content Item Report
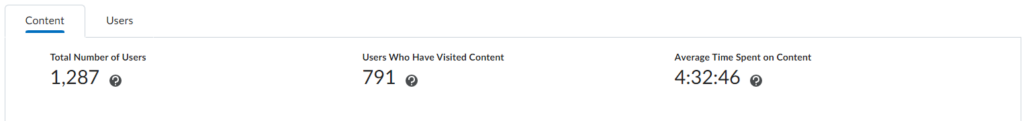
The content report gives an overview of user engagement by highlighting overall module statistics such as the total number of users, the number of users that have accessed any content items and the average time spent on content.
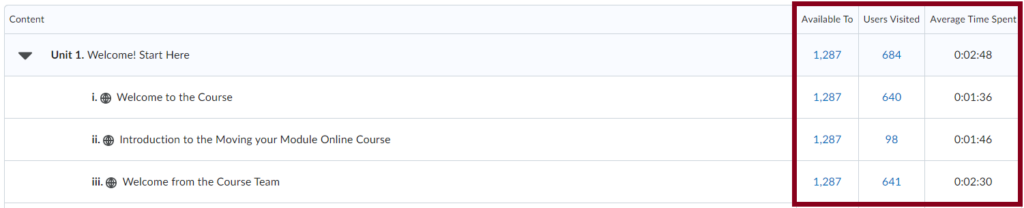
Further down it lists all the content items available on the module and provide overall statistics for each of them.
For each content unit, subunit and content item, the following data will be shown:
- Available To: This will show how many people have access to the content.
This will also take into account any applied release conditions and hidden content. - Users Visited: This will show the number of different users who have accessed the content.
- Average Time Spent: The average length of time that users have spent on the item of content.
Specific details are also available for each content item which provides details for each user on the module such as the number of times a user has accessed that content and the length of time they spent on the content item.
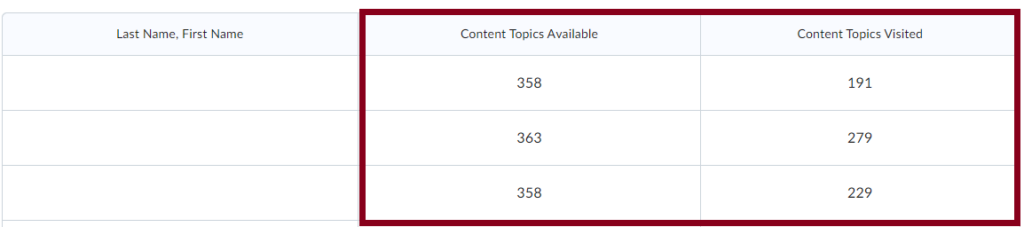
User Report
There is also a user report that is available which shows the number of content items that the user can access and the number of content items they did access.
This is shown for every user on the module.
You can then see a detailed report for each user which brings up a report of all the content items and how long that user has interacted with the content.
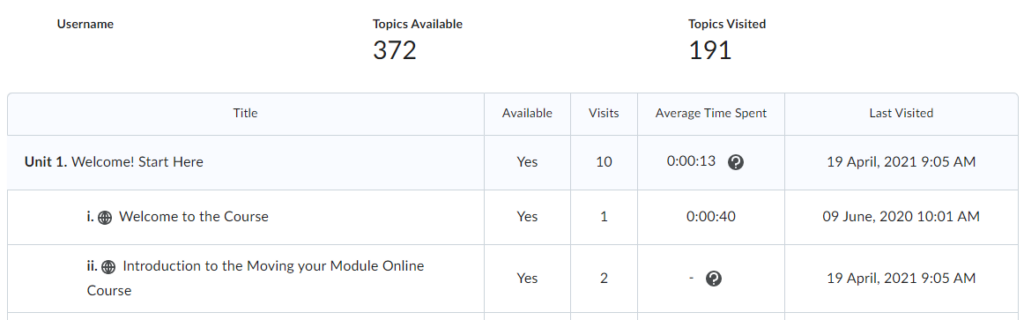
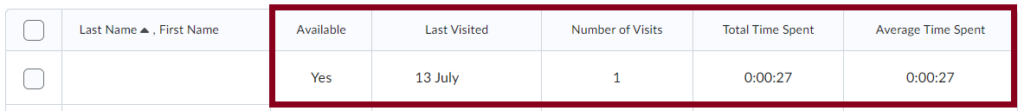
The following data is shown per content item:
- Available – Whether the user can access the specific content item.
- Visits – The number of times the user accessed the content item.
- Average Time Spent – The average time spent by the user on the content item per visit.
- Last Visited – The date that the user last accessed the content item.
To find out how to create a content report, please see the following guide.
Now that you know about creating a content report in Brightspace – why not try it yourself!
Please note: All information is accurate at the time of posting but the Brightspace / Teams layout may have updated.
For more help or information on this tool, check out the iPark website for handy how-to guides; or Brightspace Bytes on Brightspace for helpful screencast tutorials.